
The Problem
The lack of accurate data on flow rate and pressure in a pipeline connected to a turbine prevents proper performance evaluation and the detection of potential issues in the hydraulic system.
The Goal:
Develop an experimental prototype for sensor data measurement and storage to accurately record flow rate and pressure in the pipeline. The aim is to obtain reliable real-time information to analyze and ensure optimal turbine operation by evaluating its hydraulic behavior.
My Role: |
Target Audience: |
|
Electronics Engineer in the Photovoltaic Projects Department |
Clients, Project & Design Engineers, Maintenance & Operations Engineers, Quality Control & Process Teams. |
My Responsibilities: |
Duration: |
|
Identification, Research, Evaluation, Development, Design, Planning, Documentation, and Presentation. |
November - December 2021 |
General and Specific Objectives
General
Develop an experimental prototype for measuring and storing sensor data to verify the operation of a system containing a turbine.
Specific
- Design and build a prototype that measures and stores data from the sensors used in the project.
- Program menus to display the sensor readings during measurement and show error screens.
- Test the prototype and its circuit to ensure it works under the given conditions.
Variables to Measure
The critical variables identified for evaluating turbine performance are flow rate and pressure.
In fluid dynamics, flow rate is defined as the amount of fluid passing through a specific cross-section of a conduit (such as a pipe, channel, river, etc.) per unit of time. Pressure is described as the force exerted by a body (gas, liquid, or solid) on the surface it interacts with, measured in Pascals (Pa) in the International System of Units. Absolute pressure is calculated by adding atmospheric pressure and gauge pressure.
Sensors Investigated
For this project, the following sensors were carefully selected: the wall-mounted ultrasonic flowmeter, either model FDT-25W from Omega or model TDS-100F from Dalian; and the high-precision pressure transducer, either model PX409-050AV or PX409-050A5V, both from Omega.
These sensors were chosen after an in-depth evaluation of the turbine’s current system conditions and considering the project’s budget constraints.
Circuit Design
The circuit design considered budget limitations since this proposal is in its initial phase. It includes a user interface with interactive menus to display data directly on the device, a data logger for local storage, and a processing module to transmit data via Wi-Fi for web visualization.
Error codes were implemented to identify potential turbine issues, enabling remote monitoring. The design also considered the electrical conditions for both sensors and other circuit components to ensure optimal and safe performance.
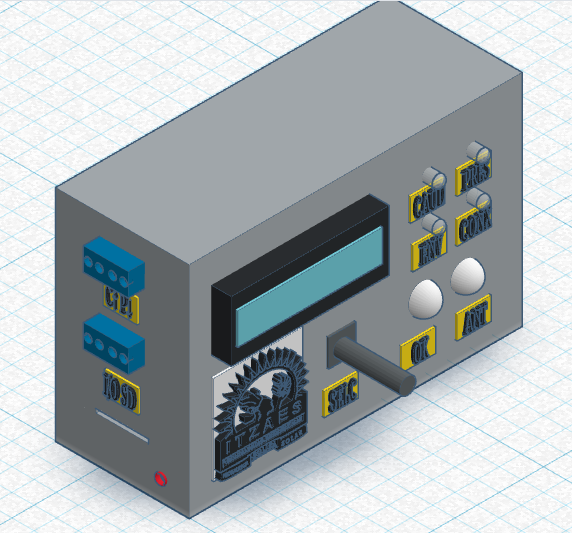
External Device Design
The external design is simple and functional, facilitating sensor connection and operation. It includes an SD card slot for data storage, a screen to display interactive menus and real-time data, and LED indicators for sensor status and data transmission.
Informative labels with user manuals and warnings were added for safe and efficient operation. The device is designed to be wall-mounted, providing flexibility for industrial or specific installation environments.
Conclusions and Recommendations
During this proposal’s development, I gained a deep understanding of the specific requirements of the environment where this type of device is needed. This process allowed me to identify the critical variables required to accurately evaluate the current situation and select the most suitable sensors considering environmental, budgetary, and operational constraints.
The electronic circuit design was carefully planned according to the expected behavior, and the external device design prioritized intuitiveness and simplicity to facilitate its use.
Although this project remained in the proposal phase, additional steps could have included circuit improvements, software optimization, extensive testing, the development of a website for data visualization, and a mobile application for more convenient system access.